Overview
Elasticsearch and Logstash have both released new major versions, v2, this post will demostrate the ELK stack using them with Docker.
We’ll be using offical Docker images from hub.docker.com
Using the ELK stack (Elasticsearch, Logstash and Kibana) we’ll implement a centralized logging system.
TL;DR
In just a few commands use docker to get an ELK v2 stack up and running.
Method
The following method has been tested with Linux Ubuntu 14:04.
Whichever Linux distro you choose, the only pre-requisite to follow along here is to have Docker installed.
A nice feature when using these Docker images to launch containers is that you can specify the exact versions you require.
The ELK stack is three pieces of software, each updating independently, so it’s very nice to be able to set the exact versions you want.
You can follow along by typing or copy pasting the following commands in red.
Step 1 - Download
These are the three docker images we’ll be downloading and launching:
- [https://hub.docker.com//elasticsearch/](https://hub.docker.com//elasticsearch/)
- [https://hub.docker.com//logstash/](https://hub.docker.com//logstash/)
- [https://hub.docker.com//kibana/](https://hub.docker.com//kibana/)
We’ll download each image one by one (you can download all 3 in one command or even at just run time):
sudo docker pull elasticsearch:2.1.0sudo docker pull logstash:2.1.0sudo docker pull kibana:4.3.0
Step 2 - Elasticsearch
- Create a directory to hold the persisted index data.
mkdir esdata- Run a Docker container, bind the esdata directory (volume) and expose port 9200 and listen on all IPs
sudo docker run -d --name elasticsearch -v "$PWD/esdata":/usr/share/elasticsearch/data -p 9200:9200 elasticsearch:2.1.0 -Des.network.bind_host=0.0.0.0- You should see some output like:
- f624c4ea0f532b8022d948befdb81299e08c57e3e3e50c75976f66366ec423a8
- Check the container is running OK:
sudo docker ps- You should see output similar to:
CONTAINER ID        IMAGE               COMMAND                CREATED             STATUS              PORTS                NAMES
391370901f42        elasticsearch:2.1.0                                                        "/docker-entrypoint.   7 seconds ago       Up 6 seconds        9300/tcp, 0.0.0.0:9200->9200/tcp
- We can also look at the start up output from the elasticsearch container.
sudo docker logs elasticsearch
You should see output similar to:
[2015-11-30 07:43:46,075][INFO ][node                     ] [Water Wizard] version[2.1.0], pid[1], build[72cd1f1/2015-11-18T22:40:03Z]
[2015-11-30 07:43:46,075][INFO ][node                     ] [Water Wizard] initializing ...
[2015-11-30 07:43:46,209][INFO ][plugins                  ] [Water Wizard] loaded [], sites []
[2015-11-30 07:43:46,296][INFO ][env                      ] [Water Wizard] using [1] data paths, mounts [[/usr/share/elasticsearch/data (/dev/disk/by-uuid/307721ef-5d43-483d-916c-8d84ea413439)]], net usable_space [16.7gb], net total_space [39.3gb], spins? [possibly], types [ext4]
[2015-11-30 07:43:50,919][INFO ][node                     ] [Water Wizard] initialized
[2015-11-30 07:43:50,948][INFO ][node                     ] [Water Wizard] starting ...
[2015-11-30 07:43:51,277][WARN ][common.network           ] [Water Wizard] publish address: {0.0.0.0} is a wildcard address, falling back to first non-loopback: {172.17.0.23}
[2015-11-30 07:43:51,278][INFO ][transport                ] [Water Wizard] publish_address {172.17.0.23:9300}, bound_addresses {[::]:9300}
[2015-11-30 07:43:51,336][INFO ][discovery                ] [Water Wizard] elasticsearch/IfHSxUEDRb-h4vxP3g_FVA
[2015-11-30 07:43:54,466][INFO ][cluster.service          ] [Water Wizard] new_master {Water Wizard}{IfHSxUEDRb-h4vxP3g_FVA}{172.17.0.23}{172.17.0.23:9300}, reason: zen-disco-join(elected_as_master, [0] joins received)
[2015-11-30 07:43:54,593][WARN ][common.network           ] [Water Wizard] publish address: {0.0.0.0} is a wildcard address, falling back to first non-loopback: {172.17.0.23}
[2015-11-30 07:43:54,594][INFO ][http                     ] [Water Wizard] publish_address {172.17.0.23:9200}, bound_addresses {[::]:9200}
[2015-11-30 07:43:54,597][INFO ][node                     ] [Water Wizard] started
[2015-11-30 07:43:54,651][INFO ][gateway                  ] [Water Wizard] recovered [0] indices into cluster_state
Elasticsearch should now be running on port 9200.
To test, point your browser at port 9200 http://localhost:9200.
You should see output similar to the following with status code of 200.
{
  "name" : "Dragon Man",
  "cluster_name" : "elasticsearch",
  "version" : {
    "number" : "2.1.0",
    "build_hash" : "72cd1f1a3eee09505e036106146dc1949dc5dc87",
    "build_timestamp" : "2015-11-18T22:40:03Z",
    "build_snapshot" : false,
    "lucene_version" : "5.3.1"
  },
  "tagline" : "You Know, for Search"
}
Step 3 - Logstash
- Create a directory for your logstash configuration files.
mkdir -p logstash/conf.d/- Create an input logstash configuration file
logstash/conf.d/input.confwith this content:
input {
    file {
        type => "test"
        path => [
            "/host/var/log/test.log"
            ]
    }
}
- Create an output logstash configuration file
logstash/conf.d/output.confwith this content:
output {
    elasticsearch {
        hosts => ["localhost"]
    }
}
- For our use case here our Docker Logstash container will monitor a log file from our host machine.
- Create a directory for log files that our Logstash Docker container will monitor.
mkdir -p var/log- Start our logstash docker container. It will watch the
test.logfile from thevar/logdirectory we just created. sudo docker run -d --name logstash -v $PWD/logstash/conf.d:/etc/logstash/conf.d:ro -v $PWD/var/log:/host/var/log:ro --net host logstash:2.1.0 logstash -f /etc/logstash/conf.d --debug- Note: We’ve used the
--debugflag for this demonstration so we can check logstash’s start up processes and watch for any errors sudo docker logs -f logstash
To test your Logstash to Elasticsearch connection, run the following command in a new shell:
echo 101 > var/log/test.log- Now lets check Elasticsearch
curl localhost:9200/logstash-*/_search?pretty=true- You should see some json format output with a “_source” property with “message” 101.
{
  "took" : 42,
  "timed_out" : false,
  "_shards" : {
    "total" : 5,
    "successful" : 5,
    "failed" : 0
  },
  "hits" : {
    "total" : 1,
    "max_score" : 1.0,
    "hits" : [ {
      "_index" : "logstash-2015.11.30",
      "_type" : "test",
      "_id" : "AVFWoIPrYVXvU5tGKQQM",
      "_score" : 1.0,
      "_source":{"message":"101","@version":"1","@timestamp":"2015-11-30T04:22:16.361Z","host":"tesla","path":"/host/var/log/test.log","type":"test"}
    } ]
  }
}
Step 4 - Kibana
sudo docker run -d --name kibana -p 5601:5601 -e ELASTICSEARCH_URL=http://localhost:9200 --net host kibana:4.3.0
Kibana should now be running on port 5601.
To test, point your web browser at port 5601 localhost:5601
You should see the Kibana UI.
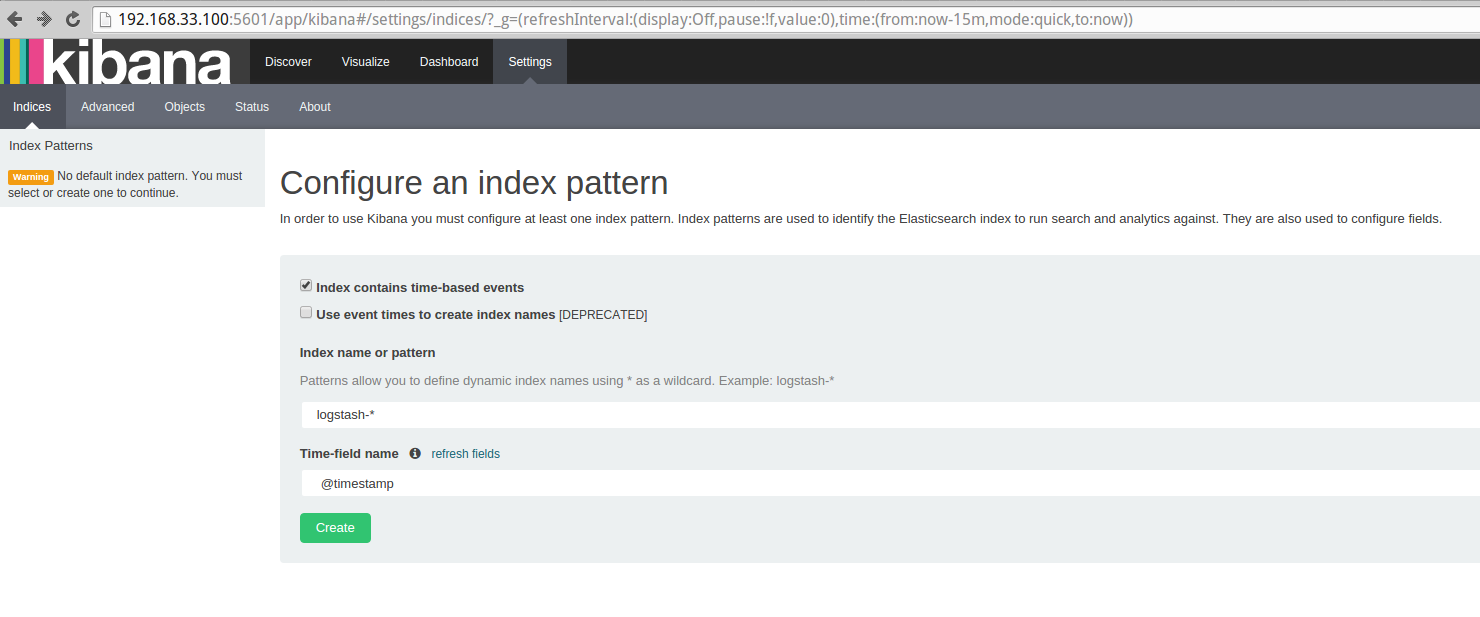
Click green Create button to create the Kibana index, then click Discover from the main top menu to load up the log entries from Elasticsearch.
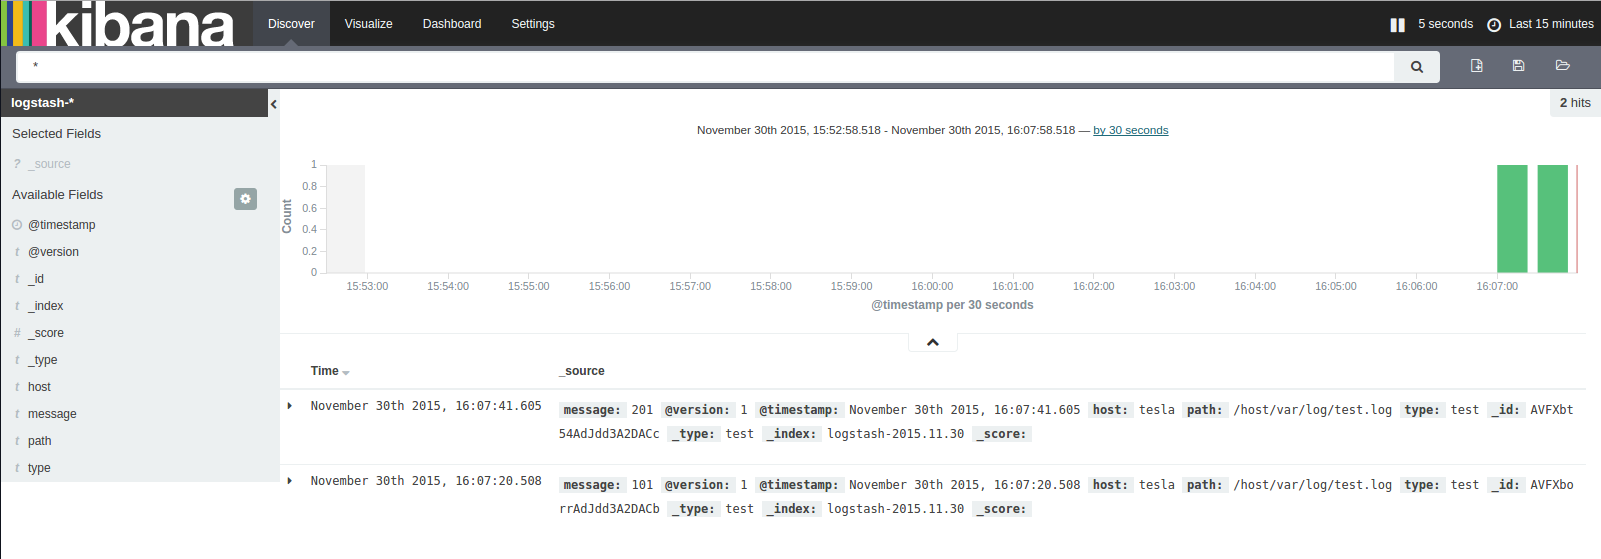
We can now start to explore some more.
Lets start by setting up Kibana to auto-refresh, click up in the top right “Last 15 minutes”
Click “Auto-refresh” and set it to ‘5 seconds’
Now let’s create a new log entry, switch to the terminal command line and enter in:
echo 201 >> var/log/test.log
Now back in Kibana after 5 or less seconds we should see the 201 log entry.
Summary
I hope this post gets you up and running quickly and painlessly - ready to explore more of the power of the ELK stack.
A good next step is to follow up with the online documentation.
- https://www.elastic.co/guide/en/logstash/current/plugins-inputs-file.html
- https://www.elastic.co/guide/en/logstash/current/plugins-outputs-elasticsearch.html
Comments and feedback are very much welcomed.
If I’ve overlooked anything, if you can see room for improvement or if any errors please do let me know.
Thanks!