Overview
In this post we’ll look at a quick start ‘how to’ with Docker and the ELK stack.
The ELK stack is, of course, Elasticsearch, Logstash and Kibana.
We’ll be using this stack to implement a centralized logging system.
This post draws inspiration from the official elastic examples github repo at github.com/elastic/examples
TLDR
In just a few commands, use docker to get an ELK stack up and running.
Method
The following method has been tested, and is being used, with Linux Ubuntu 14:04.
Installation
Install Docker
If you don’t have docker installed already, go ahead and install it.
You can find instructions for your computer at the Official installation docs
Note: Once you have docker installed, we’ll be using the command line for all install and setup steps below.
You will need to open a new shell window and type or copy and paste the following commands:
Install Elasticsearch
- Download the Offical Elasticsearch Docker image.
sudo docker pull elasticsearch
Install Logstash
- Download the Official Logstash Docker image.
sudo docker pull logstash
Install Kibana
- Download the Official Kibana 4 Docker image.
sudo docker pull kibana
Test Installation
Elasticsearch
- Create a directory to hold the persisted index data.
mkdir esdata- Run a Docker container, bind the esdata directory (volume) and expose port 9200.
sudo docker run -d --name elasticsearch -v "$PWD/esdata":/usr/share/elasticsearch/data -p 9200:9200 elasticsearch- You should see some output like:
f624c4ea0f532b8022d948befdb81299e08c57e3e3e50c75976f66366ec423a8- Check the container is running OK:
sudo docker ps- You should see output similar to:
CONTAINER ID        IMAGE               COMMAND                CREATED             STATUS              PORTS                NAMES
81acb79909b2        elasticsearch       "/docker-entrypoint.   4 seconds ago       Up 4 seconds        0.0.0.0:9200->9200/tcp, 9300/tcp   elasticsearch
- We can also look at the start up output from the elasticsearch container.
sudo docker logs elasticsearch
You should see output like:
[2015-10-04 01:30:24,859][INFO ][node                     ] [Darkoth] version[1.7.2], pid[1], build[e43676b/2015-09-14T09:49:53Z]
[2015-10-04 01:30:24,860][INFO ][node                     ] [Darkoth] initializing ...
[2015-10-04 01:30:24,901][INFO ][plugins                  ] [Darkoth] loaded [], sites []
[2015-10-04 01:30:24,924][INFO ][env                      ] [Darkoth] using [1] data paths, mounts [[/usr/share/elasticsearch/data (/dev/mapper/crypt2)]], net usable_space [101.5gb], net total_space [114gb], types [ext4]
[2015-10-04 01:30:26,507][INFO ][node                     ] [Darkoth] initialized
[2015-10-04 01:30:26,507][INFO ][node                     ] [Darkoth] starting ...
[2015-10-04 01:30:26,546][INFO ][transport                ] [Darkoth] bound_address {inet[/0:0:0:0:0:0:0:0:9300]}, publish_address {inet[/172.17.0.12:9300]}
[2015-10-04 01:30:26,556][INFO ][discovery                ] [Darkoth] elasticsearch/MoTbiQ-ZQ42H5KmQiSDznQ
[2015-10-04 01:30:30,320][INFO ][cluster.service          ] [Darkoth] new_master [Darkoth][MoTbiQ-ZQ42H5KmQiSDznQ][896132e24bd7][inet[/172.17.0.12:9300]], reason: zen-disco-join (elected_as_master)
[2015-10-04 01:30:30,348][INFO ][http                     ] [Darkoth] bound_address {inet[/0:0:0:0:0:0:0:0:9200]}, publish_address {inet[/172.17.0.12:9200]}
[2015-10-04 01:30:30,348][INFO ][node                     ] [Darkoth] started
[2015-10-04 01:30:30,363][INFO ][gateway                  ] [Darkoth] recovered [0] indices into cluster_state
Elasticsearch should now be running on port 9200.
To test, point your browser at port 9200 http://localhost:9200.
You should see output similar to the following with status code of 200.
{
  "status" : 200,
  "name" : "Letha",
  "cluster_name" : "elasticsearch",
  "version" : {
    "number" : "1.7.2",
    "build_hash" : "e43676b1385b8125d647f593f7202acbd816e8ec",
    "build_timestamp" : "2015-09-14T09:49:53Z",
    "build_snapshot" : false,
    "lucene_version" : "4.10.4"
  },
  "tagline" : "You Know, for Search"
}
Logstash
- Create a directory for your logstash configuration files.
mkdir -p logstash/conf.d/- Create an input logstash configuration file
logstash/conf.d/input.confwith this content:
input {
    file {
        type => "test"
        path => [
            "/host/var/log/test.log"
            ]
    }
}
- Create an output logstash configuration file
logstash/conf.d/output.confwith this content:
output {
    elasticsearch {
        host => ["localhost"]
        protocol => "http"
    }
}
- For our use case here our Docker Logstash container will monitor a log file from our host machine.
- Create a directory for log files that our Logstash Docker container will monitor.
mkdir -p var/log- Start our logstash docker container. It will watch the
test.logfile from thevar/logdirectory we just created. sudo docker run -d --name logstash -v $PWD/logstash/conf.d:/etc/logstash/conf.d:ro -v $PWD/var/log:/host/var/log --net host logstash logstash -f /etc/logstash/conf.d --debug- We’ve used the
--debugflag so we can check logstash’s start up processes and watch for any errors: sudo docker logs -f logstash
To test your Logstash to Elasticsearch installation, run the following command in a new shell:
echo 101 > var/log/test.log- Now lets check Elasticsearch
curl localhost:9200/logstash-*/_search?pretty=true- You should see some json format output with a “_source” property with “message” 101.
{
  "took" : 36,
  "timed_out" : false,
  "_shards" : {
    "total" : 5,
    "successful" : 5,
    "failed" : 0
  },
  "hits" : {
    "total" : 1,
    "max_score" : 1.0,
    "hits" : [ {
      "_index" : "logstash-2015.10.04",
      "_type" : "test",
      "_id" : "AVAwf1qDktIqdRR8yR3P",
      "_score" : 1.0,
      "_source":{"message":"101","@version":"1","@timestamp":"2015-10-04T01:37:43.554Z","host":"rudi-Lenovo-Y50-70","path":"/host/var/log/test.log","type":"test"}
    } ]
  }
}
Kibana
sudo docker run -d --name kibana -p 5601:5601 -e ELASTICSEARCH_URL=http://localhost:9200 --net host kibana
Kibana should now be running on port 5601.
To test, point your web browser at port 5601 localhost:5601
You should see the Kibana UI.
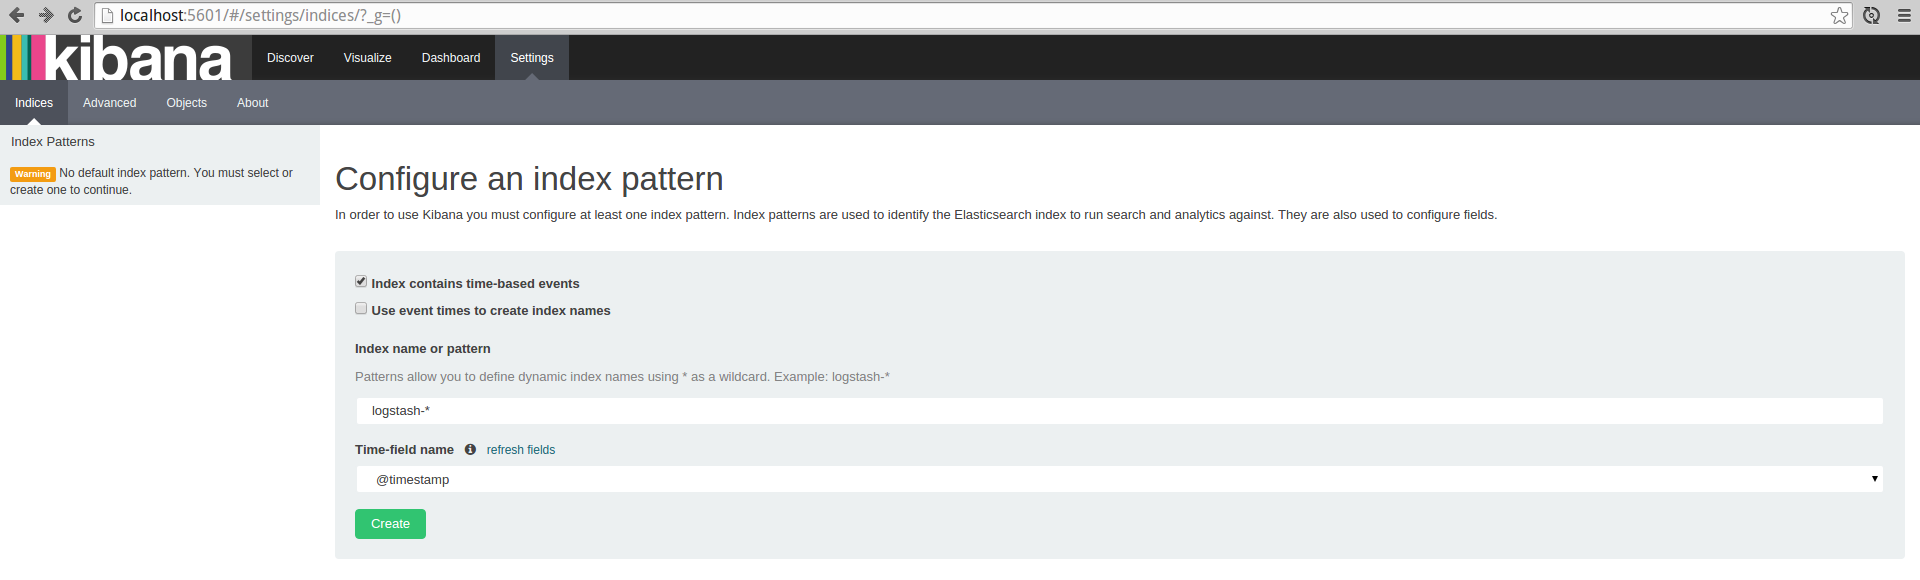
Click green Create button to create the Kibana index, then click Discover from the main top menu to load up the log entries from Elasticsearch.
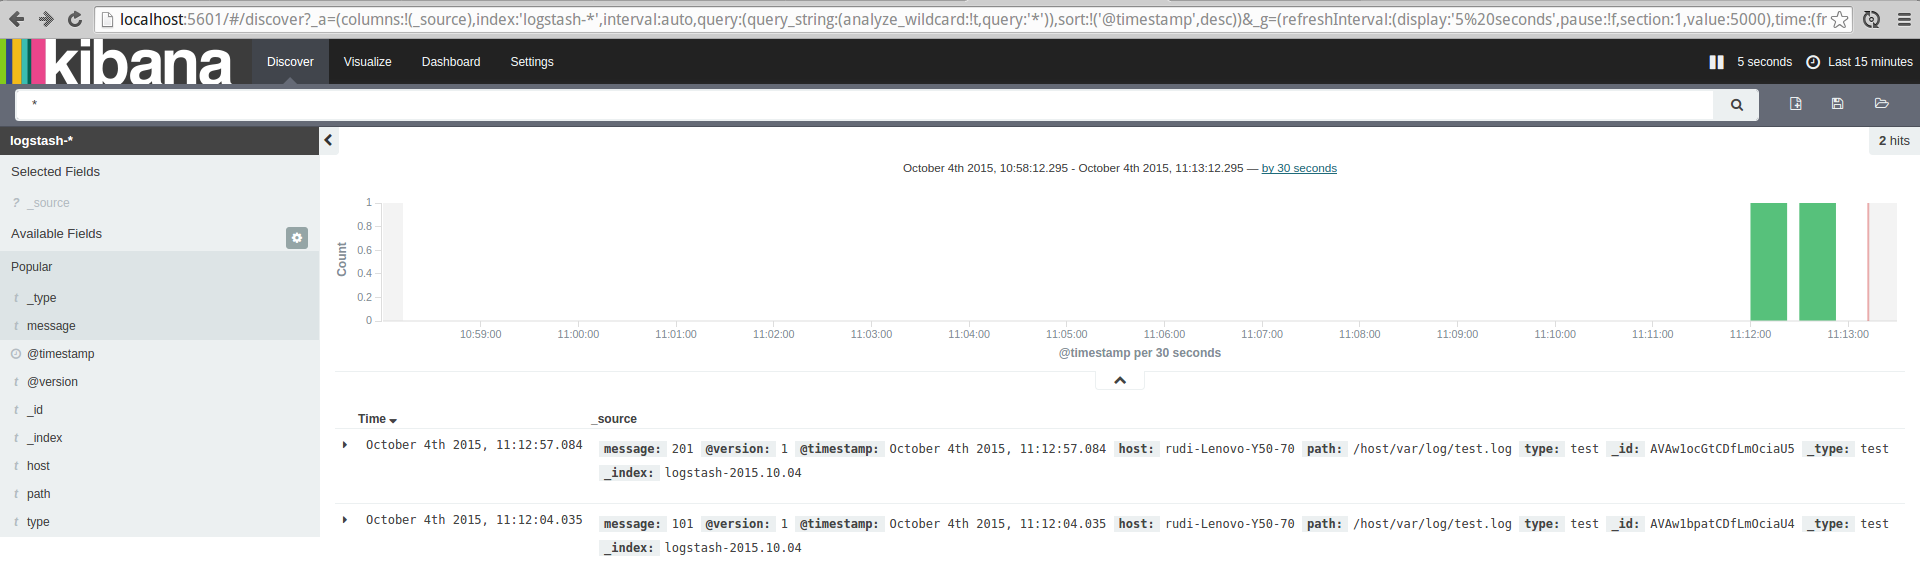
We can now start to explore some more.
Lets start by setting up Kibana to auto-refresh, click up in the top right “Last 15 minutes”
Click “Auto-refresh” and set it to ‘5 seconds’
Now let’s create a new log entry, switch to the terminal command line and enter in:
echo 201 >> var/log/test.log
Now back in Kibana after 5 or less seconds we should see the 201 log entry.
Summary
In my experience, once you know how to use and are comfortable with Docker, building and deploying an ELK stack is very quick and easy.
The steps described above are solid but for me personally I’d tweak them for production use.
For example:
- Docker has other features you can use like linking containers, so you don’t expose ports.
- Using the ‘–net host’ flag might also not be the best option for production.
- Pin the docker images you are using to a specific version eg:
sudo docker pull logstash:1.5.2 - If you have many machines, run your own Docker Private Registry so that your deployments are faster.
Anyways I hope this post gets you up and running quickly and painlessly - ready to explore more of the power of the ELK stack.
Comments and feedback are very much welcomed.
If I’ve overlooked anything, if you can see room for improvement or if any errors please do let me know.
Thanks!