rudijs.github.com

Web Development, Web Operations, Devops Blog

AWS Typescript Serverless Framework API End to End testing using Jest

Overview

Test your AWS Typescript Serverless API’s using Jest

Sample code is here

If you find any typo’s or cut-n-paste errors or mistakes please let me know.

Please also comment if you have any improvement suggestions.

The follow steps and examples was created on April 15th 2020 using:

  • Node v12.16.1
  • and Serverless Framework versions:
Framework Core: 1.67.3
Plugin: 3.6.6
SDK: 2.3.0
Components: 2.29.1

Setup from scratch

The following steps are all command line on a Unix platorm, please adjust for your platorm where required.

Create a new directory and chnage to it (for example):

mkdir serverless-e2e-typescript-example

cd serverless-e2e-typescript-example

Create an AWS Lambda serverless API:

npx serverless create --template aws-nodejs-typescript --name api

Here’s an example of the output:

❯ npx serverless create --template aws-nodejs-typescript --name api
Serverless: Generating boilerplate...
 _______                             __
|   _   .-----.----.--.--.-----.----|  .-----.-----.-----.
|   |___|  -__|   _|  |  |  -__|   _|  |  -__|__ --|__ --|
|____   |_____|__|  \___/|_____|__| |__|_____|_____|_____|
|   |   |             The Serverless Application Framework
|       |                           serverless.com, v1.67.3
 -------'

Serverless: Successfully generated boilerplate for template: "aws-nodejs-typescript"

Install the node dependencies

npm install

Edit the serverless.yml file so that we can set a default stage and region.

Under the provider section add:

stage: ${opt:stage, 'dev'}
region: ${opt:region, 'us-east-1'}

Lets make our API endpoint output only a message and not echo the Lambda input

Edit handler.ts, comment out line 9

// input: event

Deploy the API to the ‘dev’ stage.

Example deployment command and output:

> npx serverless --stage dev deploy
Serverless: Bundling with Webpack...
Time: 394ms
Built at: 04/15/2020 1:38:22 PM
         Asset      Size  Chunks                   Chunk Names
    handler.js  1.28 KiB       0  [emitted]        handler
handler.js.map  5.27 KiB       0  [emitted] [dev]  handler
Entrypoint handler = handler.js handler.js.map
[0] ./handler.ts 316 bytes {0} [built]
[1] external "source-map-support/register" 42 bytes {0} [built]
Serverless: Package lock found - Using locked versions
Serverless: Packing external modules: source-map-support@^0.5.10
Serverless: Packaging service...
Serverless: Creating Stack...
Serverless: Checking Stack create progress...
........
Serverless: Stack create finished...
Serverless: Uploading CloudFormation file to S3...
Serverless: Uploading artifacts...
Serverless: Uploading service api.zip file to S3 (289.14 KB)...
Serverless: Validating template...
Serverless: Updating Stack...
Serverless: Checking Stack update progress...
..............................
Serverless: Stack update finished...
Service Information
service: api
stage: dev
region: us-east-1
stack: api-dev
resources: 11
api keys:
  None
endpoints:
  GET - https://driyuairb6.execute-api.us-east-1.amazonaws.com/dev/hello
functions:
  hello: api-dev-hello
layers:
  None
Serverless: Run the "serverless" command to setup monitoring, troubleshooting and testing.

Lets call the new API endpoint, copy the hello endpoint from your deployment:

❯ curl https://driyuairb6.execute-api.us-east-1.amazonaws.com/dev/hello
{
  "message": "Go Serverless Webpack (Typescript) v1.0! Your function executed successfully!"
}
``

Great! Our new typescript API endpoint is working, lets setup the end-to-end testing.

Install test dependencies:

npm i -D jest ts-jest @types/jest axios

Create a testing directory and Jest config file

mkdir e2e
touch e2e/jest.config.js

This is how your jest.config.js file should be:

module.exports = {
  testEnvironment: "node",
  transform: {
    "^.+\\.tsx?$": "ts-jest",
  },
}

You can create any testing file structure you prefer but for this example we’ll be creating files of the test functions then importing them into a single test file describing all the tests in order and assigning them with the imported functions.

Create a test file for the hello API endpoint, I prefer to prefix with a number as it’s common to test API endpoints in sequence:

Create the file 100_hello.ts with the code content:

import axios from "axios"

const url = process.env.URL

export const helloTest = () => {
  test("should reply success", async () => {
    const res = await axios.get(`${url}/hello`)
    expect(res.status).toEqual(200)
    expect(res.data.message).toMatch(/Your function executed successfully!/)
  })
}

Create the test suite runner file index.test.js with the code content:

import { helloTest } from "./100_hello"

describe("hello", helloTest)

Lets run the end-to-end test manually first, then we’ll create an npm script to simplify it:

 URL=https://driyuairb6.execute-api.us-east-1.amazonaws.com/dev ./node_modules/.bin/jest -c e2e/jest.config.js  --runInBand --bail
ts-jest[config] (WARN) message TS151001: If you have issues related to imports, you should consider setting `esModuleInterop` to `true` in your TypeScript configuration file (usually `tsconfig.json`). See https://blogs.msdn.microsoft.com/typescript/2018/01/31/announcing-typescript-2-7/#easier-ecmascript-module-interoperability for more information.
 PASS  e2e/index.test.ts
  hello
    ✓ should reply success (474ms)

Test Suites: 1 passed, 1 total
Tests:       1 passed, 1 total
Snapshots:   0 total
Time:        1.059s, estimated 2s
Ran all test suites.

Yay! Our end-to-end test passes.

Let’s fix that ts-jest warning by adding "esModuleInterop": true in the tsconfig.json file

"esModuleInterop": true

Run the tests manually again:

URL=https://driyuairb6.execute-api.us-east-1.amazonaws.com/dev ./node_modules/.bin/jest -c e2e/jest.config.js --runInBand --bail
 PASS  e2e/index.test.ts
  hello
    ✓ should reply success (489ms)

Test Suites: 1 passed, 1 total
Tests:       1 passed, 1 total
Snapshots:   0 total
Time:        0.96s, estimated 2s
Ran all test suites.

Next lets create an npm script in package.json:

"scripts": {
"test": "echo \"Error: no test specified\" && exit 1",
"e2e": "jest -c e2e/jest.config.js --runInBand --bail e2e"
},

Now we can run our tests with:

URL=https://driyuairb6.execute-api.us-east-1.amazonaws.com/dev npm run e2e

> api@1.0.0 e2e /home/rudi/projects/serverless-e2e-typescript-example
> jest -c e2e/jest.config.js --runInBand e2e

 PASS  e2e/index.test.ts
  hello
    ✓ should reply success (474ms)

Test Suites: 1 passed, 1 total
Tests:       1 passed, 1 total
Snapshots:   0 total
Time:        1.001s
Ran all test suites matching /e2e/i.

Finally lets clean up with:

npx serverless --stage dev remove

npx serverless --stage dev remove
Serverless: Getting all objects in S3 bucket...
Serverless: Removing objects in S3 bucket...
Serverless: Removing Stack...
Serverless: Checking Stack removal progress...
.............
Serverless: Stack removal finished...
Credits

ELK V2 Quickstart with Official Docker Images: Elasticsearch v2, Logstash v2, Kibana v4

Overview

Elasticsearch and Logstash have both released new major versions, v2, this post will demostrate the ELK stack using them with Docker.

We’ll be using offical Docker images from hub.docker.com

Using the ELK stack (Elasticsearch, Logstash and Kibana) we’ll implement a centralized logging system.

TL;DR

In just a few commands use docker to get an ELK v2 stack up and running.

Method

The following method has been tested with Linux Ubuntu 14:04.

Whichever Linux distro you choose, the only pre-requisite to follow along here is to have Docker installed.

A nice feature when using these Docker images to launch containers is that you can specify the exact versions you require.

The ELK stack is three pieces of software, each updating independently, so it’s very nice to be able to set the exact versions you want.

You can follow along by typing or copy pasting the following commands in red.

Step 1 - Download

These are the three docker images we’ll be downloading and launching:

  • [https://hub.docker.com//elasticsearch/](https://hub.docker.com//elasticsearch/)
  • [https://hub.docker.com//logstash/](https://hub.docker.com//logstash/)
  • [https://hub.docker.com//kibana/](https://hub.docker.com//kibana/)

We’ll download each image one by one (you can download all 3 in one command or even at just run time):

  • sudo docker pull elasticsearch:2.1.0
  • sudo docker pull logstash:2.1.0
  • sudo docker pull kibana:4.3.0

Step 2 - Elasticsearch

  • Create a directory to hold the persisted index data.
  • mkdir esdata
  • Run a Docker container, bind the esdata directory (volume) and expose port 9200 and listen on all IPs
  • sudo docker run -d --name elasticsearch -v "$PWD/esdata":/usr/share/elasticsearch/data -p 9200:9200 elasticsearch:2.1.0 -Des.network.bind_host=0.0.0.0
  • You should see some output like:
  • f624c4ea0f532b8022d948befdb81299e08c57e3e3e50c75976f66366ec423a8
  • Check the container is running OK:
  • sudo docker ps
  • You should see output similar to:
CONTAINER ID        IMAGE               COMMAND                CREATED             STATUS              PORTS                NAMES
391370901f42        elasticsearch:2.1.0                                                        "/docker-entrypoint.   7 seconds ago       Up 6 seconds        9300/tcp, 0.0.0.0:9200->9200/tcp
  • We can also look at the start up output from the elasticsearch container.
  • sudo docker logs elasticsearch

You should see output similar to:

[2015-11-30 07:43:46,075][INFO ][node                     ] [Water Wizard] version[2.1.0], pid[1], build[72cd1f1/2015-11-18T22:40:03Z]
[2015-11-30 07:43:46,075][INFO ][node                     ] [Water Wizard] initializing ...
[2015-11-30 07:43:46,209][INFO ][plugins                  ] [Water Wizard] loaded [], sites []
[2015-11-30 07:43:46,296][INFO ][env                      ] [Water Wizard] using [1] data paths, mounts [[/usr/share/elasticsearch/data (/dev/disk/by-uuid/307721ef-5d43-483d-916c-8d84ea413439)]], net usable_space [16.7gb], net total_space [39.3gb], spins? [possibly], types [ext4]
[2015-11-30 07:43:50,919][INFO ][node                     ] [Water Wizard] initialized
[2015-11-30 07:43:50,948][INFO ][node                     ] [Water Wizard] starting ...
[2015-11-30 07:43:51,277][WARN ][common.network           ] [Water Wizard] publish address: {0.0.0.0} is a wildcard address, falling back to first non-loopback: {172.17.0.23}
[2015-11-30 07:43:51,278][INFO ][transport                ] [Water Wizard] publish_address {172.17.0.23:9300}, bound_addresses {[::]:9300}
[2015-11-30 07:43:51,336][INFO ][discovery                ] [Water Wizard] elasticsearch/IfHSxUEDRb-h4vxP3g_FVA
[2015-11-30 07:43:54,466][INFO ][cluster.service          ] [Water Wizard] new_master {Water Wizard}{IfHSxUEDRb-h4vxP3g_FVA}{172.17.0.23}{172.17.0.23:9300}, reason: zen-disco-join(elected_as_master, [0] joins received)
[2015-11-30 07:43:54,593][WARN ][common.network           ] [Water Wizard] publish address: {0.0.0.0} is a wildcard address, falling back to first non-loopback: {172.17.0.23}
[2015-11-30 07:43:54,594][INFO ][http                     ] [Water Wizard] publish_address {172.17.0.23:9200}, bound_addresses {[::]:9200}
[2015-11-30 07:43:54,597][INFO ][node                     ] [Water Wizard] started
[2015-11-30 07:43:54,651][INFO ][gateway                  ] [Water Wizard] recovered [0] indices into cluster_state

Elasticsearch should now be running on port 9200.

To test, point your browser at port 9200 http://localhost:9200.

You should see output similar to the following with status code of 200.

{
  "name" : "Dragon Man",
  "cluster_name" : "elasticsearch",
  "version" : {
    "number" : "2.1.0",
    "build_hash" : "72cd1f1a3eee09505e036106146dc1949dc5dc87",
    "build_timestamp" : "2015-11-18T22:40:03Z",
    "build_snapshot" : false,
    "lucene_version" : "5.3.1"
  },
  "tagline" : "You Know, for Search"
}

Step 3 - Logstash

  • Create a directory for your logstash configuration files.
  • mkdir -p logstash/conf.d/
  • Create an input logstash configuration file logstash/conf.d/input.conf with this content:
input {
    file {
        type => "test"
        path => [
            "/host/var/log/test.log"
            ]
    }
}
  • Create an output logstash configuration file logstash/conf.d/output.conf with this content:
output {
    elasticsearch {
        hosts => ["localhost"]
    }
}
  • For our use case here our Docker Logstash container will monitor a log file from our host machine.
  • Create a directory for log files that our Logstash Docker container will monitor.
  • mkdir -p var/log
  • Start our logstash docker container. It will watch the test.log file from the var/log directory we just created.
  • sudo docker run -d --name logstash -v $PWD/logstash/conf.d:/etc/logstash/conf.d:ro -v $PWD/var/log:/host/var/log:ro --net host logstash:2.1.0 logstash -f /etc/logstash/conf.d --debug
  • Note: We’ve used the --debug flag for this demonstration so we can check logstash’s start up processes and watch for any errors
  • sudo docker logs -f logstash

To test your Logstash to Elasticsearch connection, run the following command in a new shell:

  • echo 101 > var/log/test.log
  • Now lets check Elasticsearch
  • curl localhost:9200/logstash-*/_search?pretty=true
  • You should see some json format output with a “_source” property with “message” 101.
{
  "took" : 42,
  "timed_out" : false,
  "_shards" : {
    "total" : 5,
    "successful" : 5,
    "failed" : 0
  },
  "hits" : {
    "total" : 1,
    "max_score" : 1.0,
    "hits" : [ {
      "_index" : "logstash-2015.11.30",
      "_type" : "test",
      "_id" : "AVFWoIPrYVXvU5tGKQQM",
      "_score" : 1.0,
      "_source":{"message":"101","@version":"1","@timestamp":"2015-11-30T04:22:16.361Z","host":"tesla","path":"/host/var/log/test.log","type":"test"}
    } ]
  }
}

Step 4 - Kibana

  • sudo docker run -d --name kibana -p 5601:5601 -e ELASTICSEARCH_URL=http://localhost:9200 --net host kibana:4.3.0

Kibana should now be running on port 5601.

To test, point your web browser at port 5601 localhost:5601

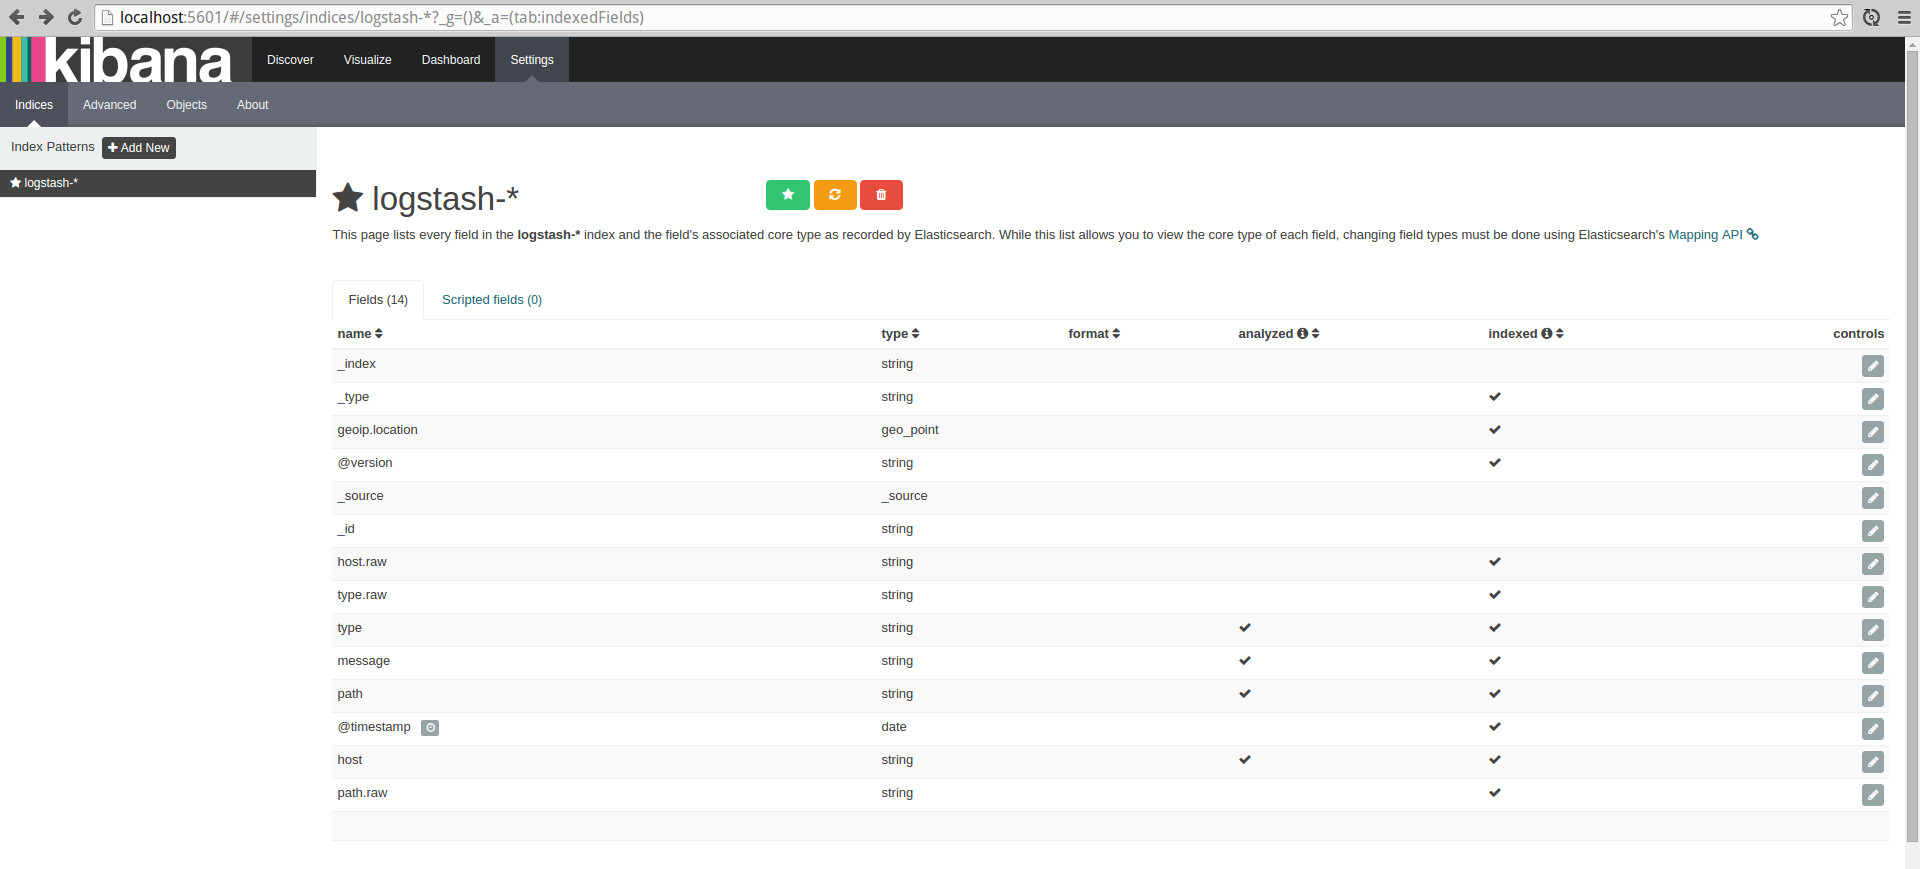
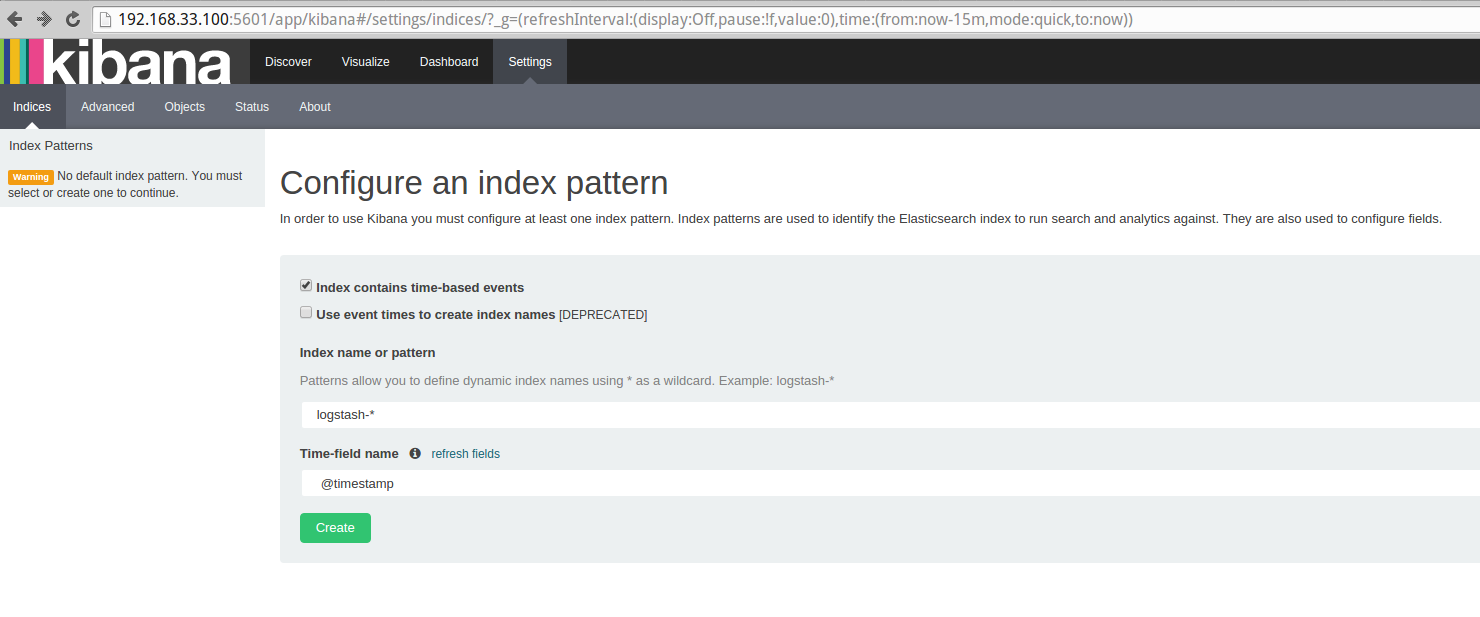
You should see the Kibana UI.

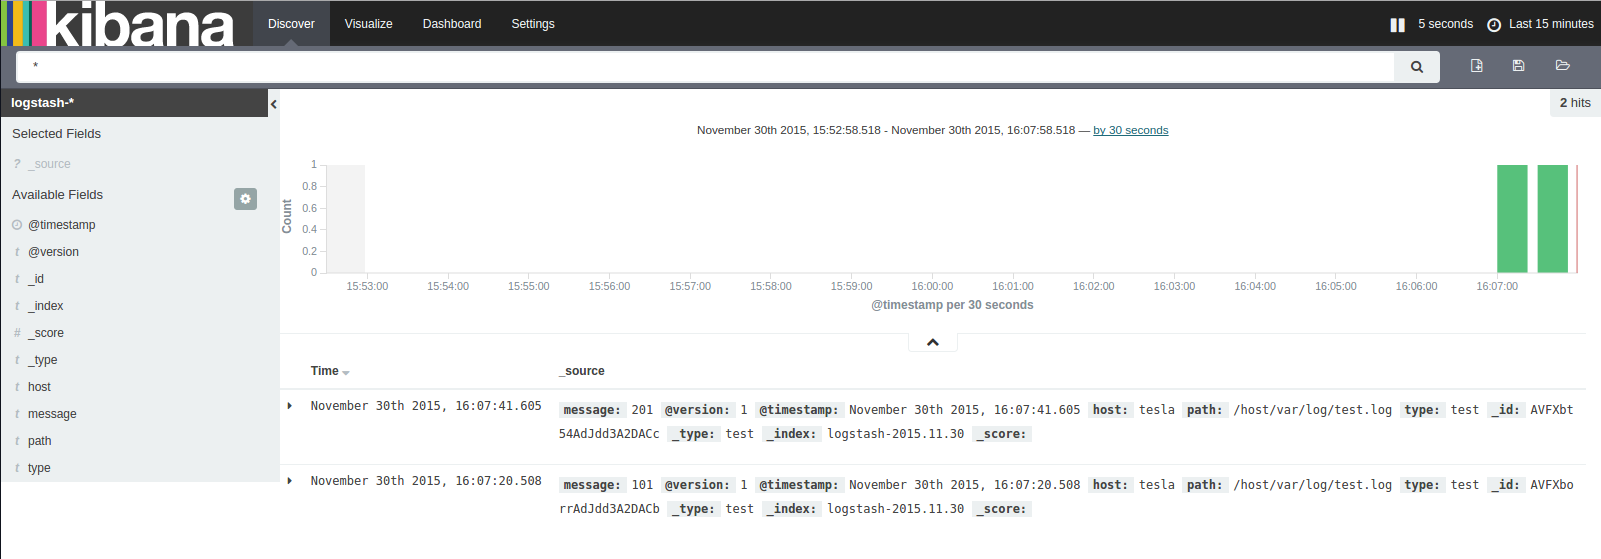
Click green Create button to create the Kibana index, then click Discover from the main top menu to load up the log entries from Elasticsearch.

We can now start to explore some more.

Lets start by setting up Kibana to auto-refresh, click up in the top right “Last 15 minutes”

Click “Auto-refresh” and set it to ‘5 seconds’

Now let’s create a new log entry, switch to the terminal command line and enter in:

echo 201 >> var/log/test.log

Now back in Kibana after 5 or less seconds we should see the 201 log entry.

Summary

I hope this post gets you up and running quickly and painlessly - ready to explore more of the power of the ELK stack.

A good next step is to follow up with the online documentation.

Comments and feedback are very much welcomed.

If I’ve overlooked anything, if you can see room for improvement or if any errors please do let me know.

Thanks!

Docker Elasticsearch v2 Geolocation Sort and Filter

Overview

Now that Elasticsearch v2.0.0 is out lets take a quick look at how quick and easy it is to explore it’s features using Docker.

This post will demonstrate two Elasticsearch Geolocation features using the official Docker image with Linux Ubuntu 14.04:

  1. Sorting by Distance
  2. Geo Distance Filter

All the following steps are commands that you will run from a terminal.

You can type them out or copy and paste them directly.

Setup

Clone the code repository and cd into it:

Start an Elasticsearch Docker container.

This command will download the official Elasticsearch v2.0.0 image from hub.docker.com and start a container instance:

  • sudo docker run -d --name elasticsearch -v "$PWD/esdata":/usr/share/elasticsearch/data -p 9200:9200 elasticsearch:2.0.0 -Des.network.bind_host=0.0.0.0

Create

Create a new Elasticsearch index

  • curl -XPUT http://localhost:9200/geo

Create a mapping on the new index for our data

  • mapping_place.json
  • curl -XPUT localhost:9200/geo/_mapping/place --data-binary @mapping_place.json

Geo Location Data

For this demostration we’ll be using the East Coast of Australia from Cairns to Hobart.

Australian East Coast

Add some ‘places’ to our index

Click the links to the place_ files below to view the JSON query objects being sent to the server.

  • place_brisbane.json
  • curl -XPOST http://localhost:9200/geo/place/ --data-binary @place_brisbane.json
  • place_sydney.json
  • curl -XPOST http://localhost:9200/geo/place/ --data-binary @place_sydney.json
  • place_melbourne.json
  • curl -XPOST http://localhost:9200/geo/place/ --data-binary @place_melbourne.json

Search all data (no sorting or filters):

  • curl -s -XGET http://localhost:9200/geo/place/_search
  • Results: Brisbane, Sydney, Melbourne

The next searches we’ll do will be JSON objects that we POST to the server.

Click the links to the query_ files below to view the JSON query objects being sent to the server.

Search and sort by distance:

  • Search from Cairns in Far North Queensland (Top of the map): query_distance_from_cairns.json
  • curl -s -XPOST http://localhost:9200/geo/place/_search --data-binary @query_distance_from_cairns.json
  • Results: Brisbane, Sydney, Melbourne
  • Search from Hobart in Tasmania (Bottom of the map): query_distance_from_hobart.json
  • curl -s -XPOST http://localhost:9200/geo/place/_search --data-binary @query_distance_from_hobart.json
  • Results: Melbourne, Sydney, Brisbane
  • Search from Canberra, the National Capital, which is nearer to Sydney: query_distance_from_canberra.json
  • curl -s -XPOST http://localhost:9200/geo/place/_search --data-binary @query_distance_from_canberra.json
  • Results: Sydney, Melbourne, Brisbane

Search, sort and filter by distance:

  • Search from Hobart in Tasmania (Bottom of the map) and limit the distance range to 1,500km: query_distance_from_hobart_filter_1500km.json
  • curl -s -XPOST http://localhost:9200/geo/place/_search --data-binary @query_distance_from_hobart_filter_1500km.json
  • Results: Melbourne, Sydney

Summary

Deploying Elasticsearch v2.0.0 with Docker and using Elasticsearch’s Geolocation features is clean, simple and very powerful.

For complete details on the tools and options available consult the Official Documentation

I hope this post gets you up and running quickly and painlessly - ready to explore more of the power of the Elasticsearch.

Comments and feedback are very much welcomed.

If I’ve overlooked anything, if you can see room for improvement or if any errors please do let me know.

Thanks!

Docker ELK Quickstart: Elasticsearch, Logstash, Kibana

Overview

In this post we’ll look at a quick start ‘how to’ with Docker and the ELK stack.

The ELK stack is, of course, Elasticsearch, Logstash and Kibana.

We’ll be using this stack to implement a centralized logging system.

This post draws inspiration from the official elastic examples github repo at github.com/elastic/examples

TLDR

In just a few commands, use docker to get an ELK stack up and running.

Method

The following method has been tested, and is being used, with Linux Ubuntu 14:04.

Installation

Install Docker

If you don’t have docker installed already, go ahead and install it.

You can find instructions for your computer at the Official installation docs

Note: Once you have docker installed, we’ll be using the command line for all install and setup steps below.

You will need to open a new shell window and type or copy and paste the following commands:

Install Elasticsearch

Install Logstash

Install Kibana

Test Installation

Elasticsearch

  • Create a directory to hold the persisted index data.
  • mkdir esdata
  • Run a Docker container, bind the esdata directory (volume) and expose port 9200.
  • sudo docker run -d --name elasticsearch -v "$PWD/esdata":/usr/share/elasticsearch/data -p 9200:9200 elasticsearch
  • You should see some output like:
  • f624c4ea0f532b8022d948befdb81299e08c57e3e3e50c75976f66366ec423a8
  • Check the container is running OK:
  • sudo docker ps
  • You should see output similar to:
CONTAINER ID        IMAGE               COMMAND                CREATED             STATUS              PORTS                NAMES
81acb79909b2        elasticsearch       "/docker-entrypoint.   4 seconds ago       Up 4 seconds        0.0.0.0:9200->9200/tcp, 9300/tcp   elasticsearch
  • We can also look at the start up output from the elasticsearch container.
  • sudo docker logs elasticsearch

You should see output like:

[2015-10-04 01:30:24,859][INFO ][node                     ] [Darkoth] version[1.7.2], pid[1], build[e43676b/2015-09-14T09:49:53Z]
[2015-10-04 01:30:24,860][INFO ][node                     ] [Darkoth] initializing ...
[2015-10-04 01:30:24,901][INFO ][plugins                  ] [Darkoth] loaded [], sites []
[2015-10-04 01:30:24,924][INFO ][env                      ] [Darkoth] using [1] data paths, mounts [[/usr/share/elasticsearch/data (/dev/mapper/crypt2)]], net usable_space [101.5gb], net total_space [114gb], types [ext4]
[2015-10-04 01:30:26,507][INFO ][node                     ] [Darkoth] initialized
[2015-10-04 01:30:26,507][INFO ][node                     ] [Darkoth] starting ...
[2015-10-04 01:30:26,546][INFO ][transport                ] [Darkoth] bound_address {inet[/0:0:0:0:0:0:0:0:9300]}, publish_address {inet[/172.17.0.12:9300]}
[2015-10-04 01:30:26,556][INFO ][discovery                ] [Darkoth] elasticsearch/MoTbiQ-ZQ42H5KmQiSDznQ
[2015-10-04 01:30:30,320][INFO ][cluster.service          ] [Darkoth] new_master [Darkoth][MoTbiQ-ZQ42H5KmQiSDznQ][896132e24bd7][inet[/172.17.0.12:9300]], reason: zen-disco-join (elected_as_master)
[2015-10-04 01:30:30,348][INFO ][http                     ] [Darkoth] bound_address {inet[/0:0:0:0:0:0:0:0:9200]}, publish_address {inet[/172.17.0.12:9200]}
[2015-10-04 01:30:30,348][INFO ][node                     ] [Darkoth] started
[2015-10-04 01:30:30,363][INFO ][gateway                  ] [Darkoth] recovered [0] indices into cluster_state

Elasticsearch should now be running on port 9200.

To test, point your browser at port 9200 http://localhost:9200.

You should see output similar to the following with status code of 200.

{
  "status" : 200,
  "name" : "Letha",
  "cluster_name" : "elasticsearch",
  "version" : {
    "number" : "1.7.2",
    "build_hash" : "e43676b1385b8125d647f593f7202acbd816e8ec",
    "build_timestamp" : "2015-09-14T09:49:53Z",
    "build_snapshot" : false,
    "lucene_version" : "4.10.4"
  },
  "tagline" : "You Know, for Search"
}

Logstash

  • Create a directory for your logstash configuration files.
  • mkdir -p logstash/conf.d/
  • Create an input logstash configuration file logstash/conf.d/input.conf with this content:
input {
    file {
        type => "test"
        path => [
            "/host/var/log/test.log"
            ]
    }
}
  • Create an output logstash configuration file logstash/conf.d/output.conf with this content:
output {
    elasticsearch {
        host => ["localhost"]
        protocol => "http"
    }
}
  • For our use case here our Docker Logstash container will monitor a log file from our host machine.
  • Create a directory for log files that our Logstash Docker container will monitor.
  • mkdir -p var/log
  • Start our logstash docker container. It will watch the test.log file from the var/log directory we just created.
  • sudo docker run -d --name logstash -v $PWD/logstash/conf.d:/etc/logstash/conf.d:ro -v $PWD/var/log:/host/var/log --net host logstash logstash -f /etc/logstash/conf.d --debug
  • We’ve used the --debug flag so we can check logstash’s start up processes and watch for any errors:
  • sudo docker logs -f logstash

To test your Logstash to Elasticsearch installation, run the following command in a new shell:

  • echo 101 > var/log/test.log
  • Now lets check Elasticsearch
  • curl localhost:9200/logstash-*/_search?pretty=true
  • You should see some json format output with a “_source” property with “message” 101.
{
  "took" : 36,
  "timed_out" : false,
  "_shards" : {
    "total" : 5,
    "successful" : 5,
    "failed" : 0
  },
  "hits" : {
    "total" : 1,
    "max_score" : 1.0,
    "hits" : [ {
      "_index" : "logstash-2015.10.04",
      "_type" : "test",
      "_id" : "AVAwf1qDktIqdRR8yR3P",
      "_score" : 1.0,
      "_source":{"message":"101","@version":"1","@timestamp":"2015-10-04T01:37:43.554Z","host":"rudi-Lenovo-Y50-70","path":"/host/var/log/test.log","type":"test"}
    } ]
  }
}

Kibana

  • sudo docker run -d --name kibana -p 5601:5601 -e ELASTICSEARCH_URL=http://localhost:9200 --net host kibana

Kibana should now be running on port 5601.

To test, point your web browser at port 5601 localhost:5601

You should see the Kibana UI.

Click green Create button to create the Kibana index, then click Discover from the main top menu to load up the log entries from Elasticsearch.

We can now start to explore some more.

Lets start by setting up Kibana to auto-refresh, click up in the top right “Last 15 minutes”

Click “Auto-refresh” and set it to ‘5 seconds’

Now let’s create a new log entry, switch to the terminal command line and enter in:

echo 201 >> var/log/test.log

Now back in Kibana after 5 or less seconds we should see the 201 log entry.

Summary

In my experience, once you know how to use and are comfortable with Docker, building and deploying an ELK stack is very quick and easy.

The steps described above are solid but for me personally I’d tweak them for production use.

For example:

  1. Docker has other features you can use like linking containers, so you don’t expose ports.
  2. Using the ‘–net host’ flag might also not be the best option for production.
  3. Pin the docker images you are using to a specific version eg: sudo docker pull logstash:1.5.2
  4. If you have many machines, run your own Docker Private Registry so that your deployments are faster.

Anyways I hope this post gets you up and running quickly and painlessly - ready to explore more of the power of the ELK stack.

Comments and feedback are very much welcomed.

If I’ve overlooked anything, if you can see room for improvement or if any errors please do let me know.

Thanks!

Couchbase Node.js SDK Callbacks to Promises

Overview

Where possible I prefer to use Promises rather than Callbacks when coding in Node.js.

The Couchbase Node.js SDK 2.0 documentation examples use the callback style of coding.

Here is an approach to “roll your own Couchbase Node.js Promises”.

The following Node.js code uses Q to convert those code examples to Promises.

These examples will dependency inject into the functions rather than reference global variables.

The final example will use ramda.js and curry the functions.

Setup

'use strict';

var assert = require('assert'),
  couchbase = require('couchbase'),
  Q = require('q'),
  R = require('ramda');

var cluster = new couchbase.Cluster('couchbase://localhost');
var bucket = cluster.openBucket('default');

Code - Callbacks to Promises

// myBucket.insert('document_name', {some:'value'}, function(err, res) {
// console.log('Success!');
// });

function bucketInsert(bucket, documentName, documentValue) {

  assert.equal(typeof bucket, 'object', 'argument bucket must be an object');
  assert.equal(typeof documentName, 'string', 'argument documentName must be a string');
  assert.equal(typeof documentValue, 'object', 'argument documentValue must be an object');

  return Q.ninvoke(bucket, 'insert', documentName, documentValue).then(function (res) {

    if (!res.cas) {
      throw new Error('Bucket Insert Failed.');
    }

    return res;

  });

}

// myBucket.get('document_name', function(err, res) {
// console.log('Value: ', res.value);
// });

function bucketGet(bucket, documentName) {

  assert.equal(typeof bucket, 'object', 'argument bucket must be an object');
  assert.equal(typeof documentName, 'string', 'argument documentName must be a string');

  return Q.ninvoke(bucket, 'get', documentName).then(function (res) {

    if (!res.cas || !res.value) {
      throw new Error('Bucket Get Failed.');
    }

    return res.value;

  });

}

Usage

/* Insert */
bucketInsert(bucket, 'document_name', {some: 'value'})
  .then(function (res) {
    console.log('Success!');
  })
  .catch(function (err) {
    console.log(err);
  });

// outputs:
// Success!


/* Get */
bucketGet(bucket, 'document_name')
  .then(function (res) {
    console.log(res);
  })
  .catch(function (err) {
    console.log(err);
  });
  
// outputs
// { some: 'value' }


/* Chained Insert and Get */
bucketInsert(bucket, 'document_name2', {some: 'value2'})
  .then(function () {
    return bucketGet(bucket, 'document_name2')
  })
  .then(function (res) {
    console.log(res);
  })
  .catch(function (err) {
    console.log(err);
  });

// outputs
// { some: 'value2' }
 

/* Curry and Chain Insert and Get */
var curriedInsert = R.curry(bucketInsert),
  insert = curriedInsert(bucket);

var curriedGet = R.curry(bucketGet),
  get = curriedGet(bucket);

insert('document_name3', {some: 'value3'})
  .then(function () {
    return get('document_name3')
  })
  .then(function (res) {
    console.log(res);
  })
  .catch(function (err) {
    console.log(err);
  });
  
// outputs
// { some: 'value3' }  

Summary

This approach works well for me and I’m quite pleased with it.

The next post will demonstrate Unit testing this code with Mocha, Sinon.js and Chai.js.

I hope this helps, comments and feedback are very much welcomed.

If I’ve overlooked anything, if you can see room for improvement or if any errors please do let me know.

Thanks!